Use Case: Reviewing Analytics
How to review and act on analytics data to improve your organization's performance.
Step 1: Review the Organization Dashboard
Open the Dashboard
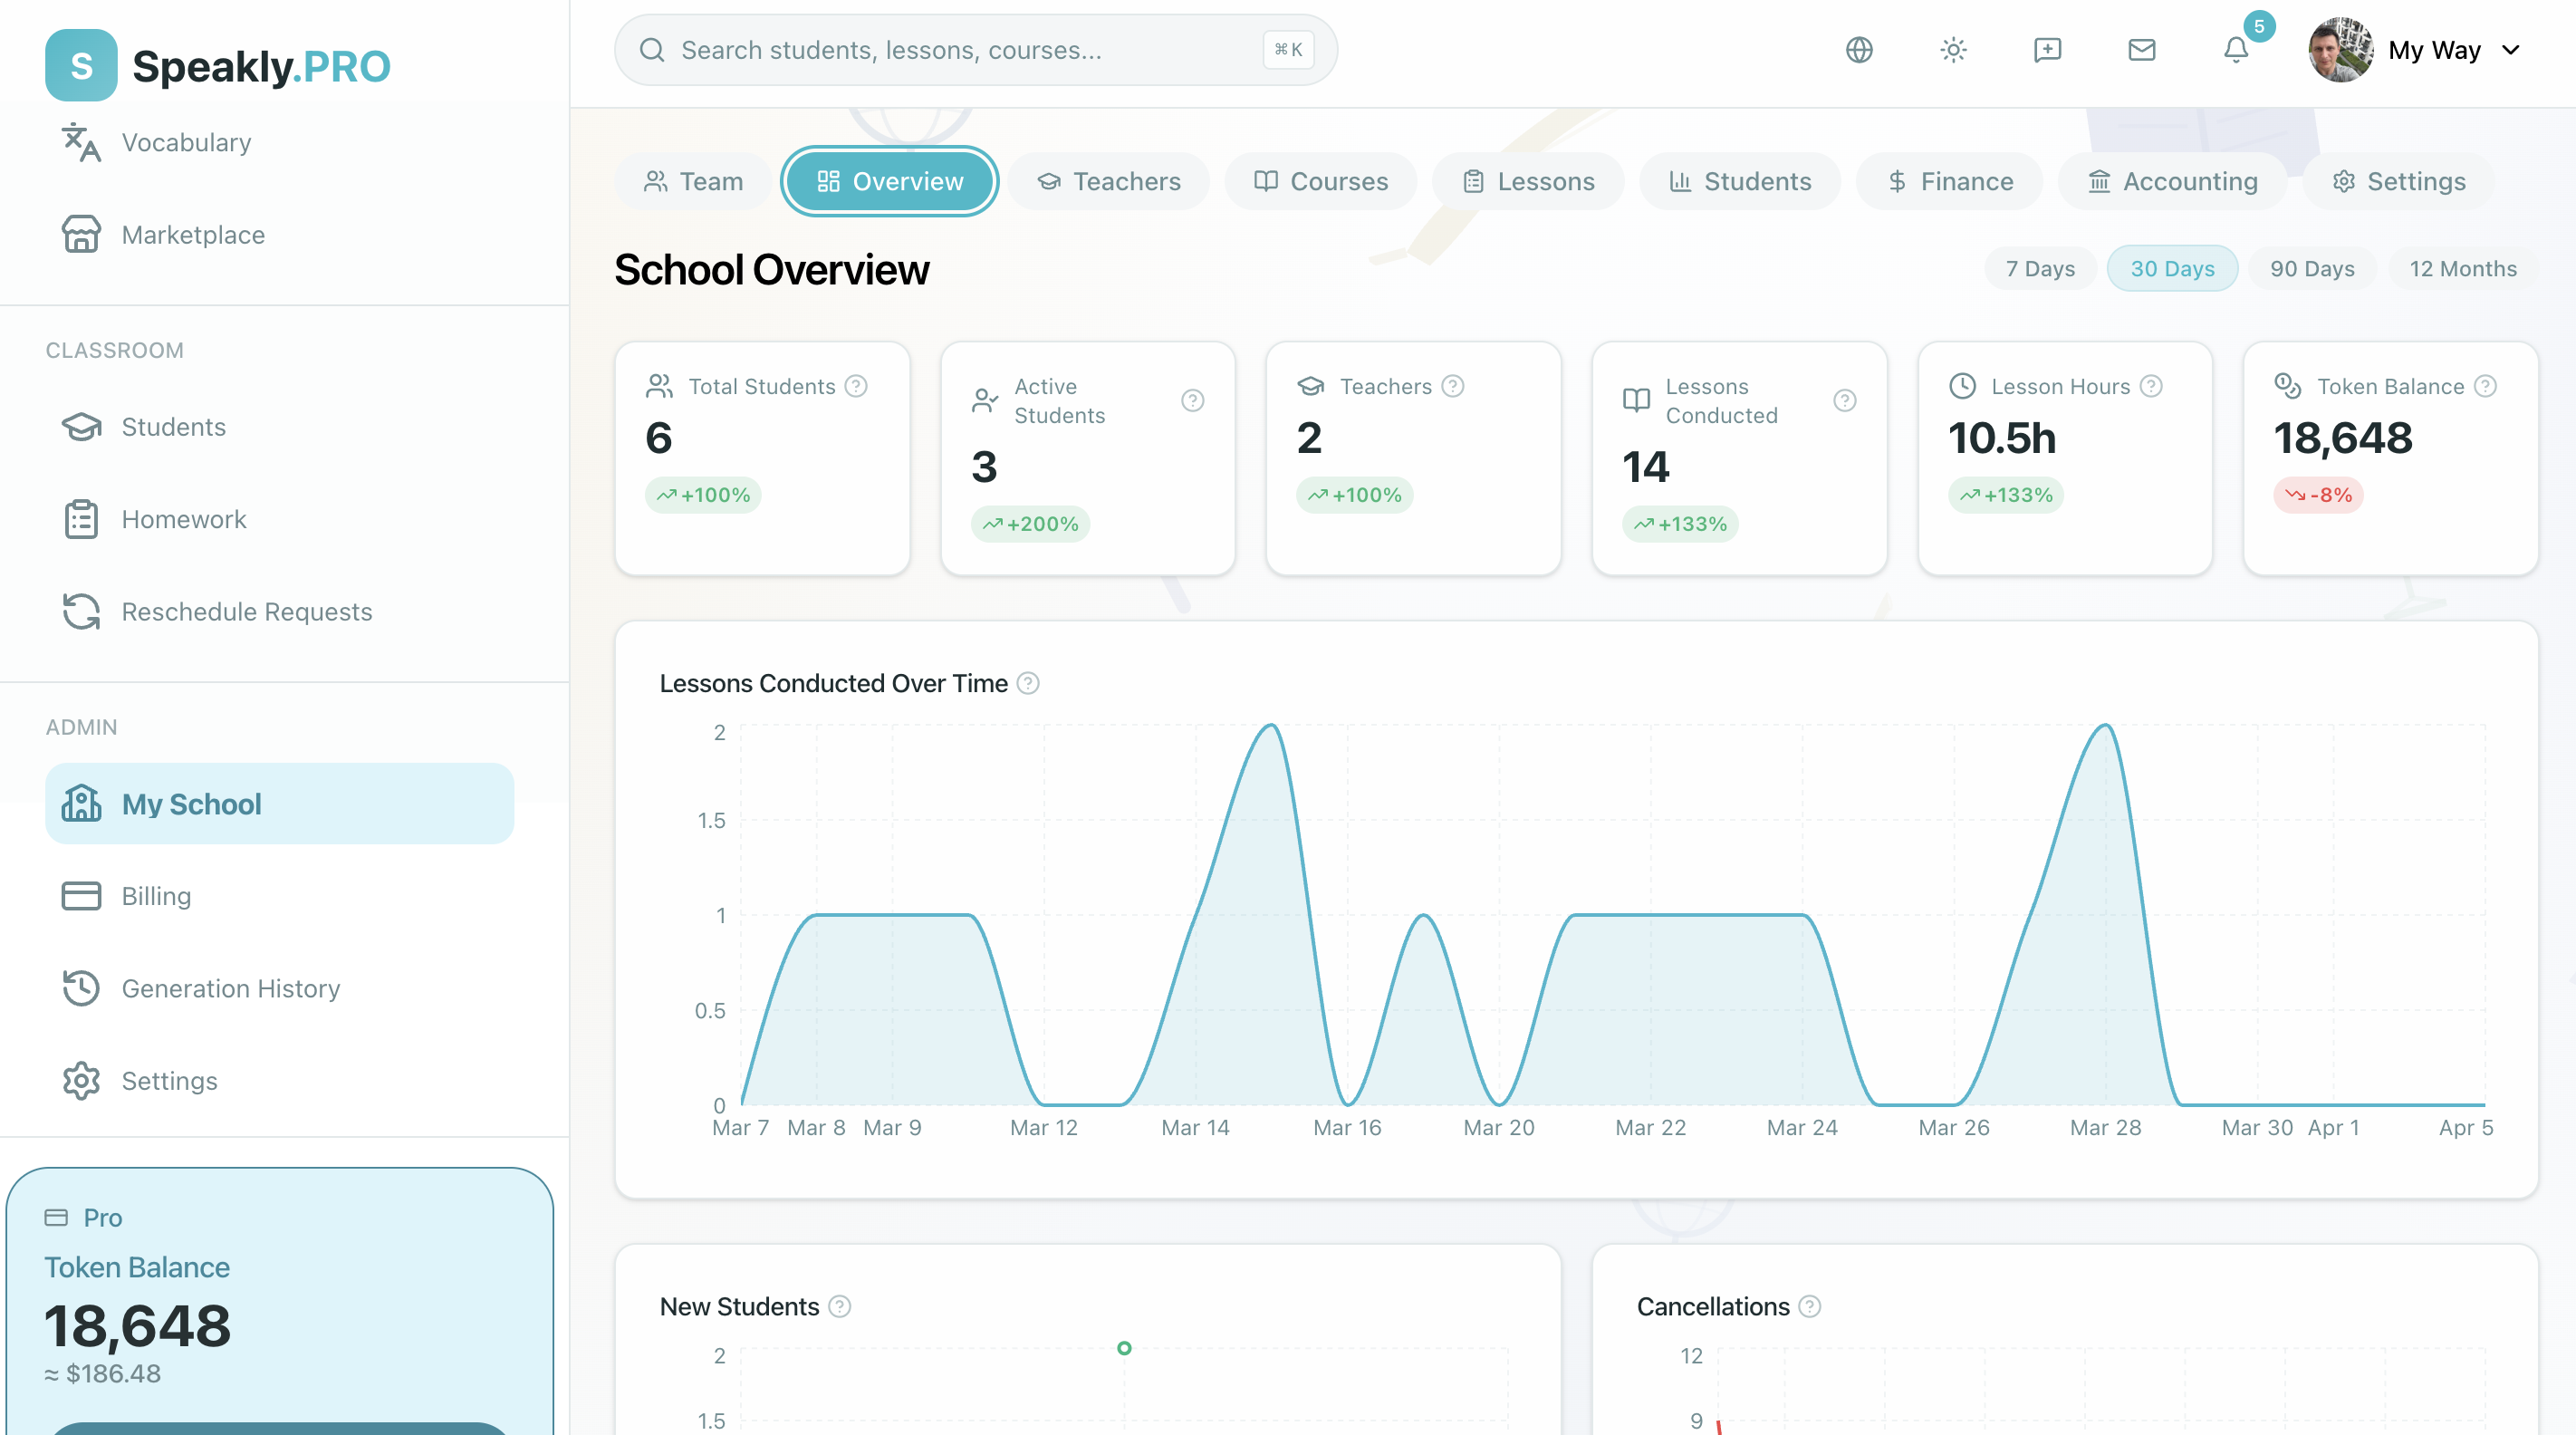
Navigate to My School > Overview. This is your starting point for every analytics review.
Check the Key Metrics
Look at the six primary cards:
| Metric | This Week | Last Week | Trend |
|---|---|---|---|
| Total Students | 40 | 40 | Flat |
| Active Students | 34 | 36 | Down |
| Teachers | 5 | 5 | Flat |
| Lessons Conducted | 28 | 32 | Down |
| Lesson Hours | 21 | 24 | Down |
| AI Credit Availability | Lower | Higher | Down |
Identify Concerns
In this example, several metrics have declined: Active Students, Lessons Conducted, Lesson Hours, and AI Credit Availability. These warrant investigation in the relevant school dashboards.
Step 2: Investigate Student Activity
The active student count dropped from 36 to 34. Find out who stopped engaging and why.
Open Student Progress Analytics
Navigate to My School > Students.
Filter for Inactive Students
Set the activity filter to No activity in the last 7 days. This shows the students who did not log in or complete any work last week.
Review Each Inactive Student
For each inactive student, check:
- Last login date -- how long ago did they last use the platform?
- Assigned teacher -- is the teacher actively engaging with them?
- Recent scores -- were their last scores unusually low (potential frustration)?
- Homework status -- do they have incomplete homework?
Take Action
Based on what you find:
- If a student has not logged in for more than 7 days, ask their assigned teacher to reach out.
- If the teacher has not been responsive, send a message directly or consider a transfer.
- If scores were declining before the student went inactive, the content level may be wrong -- discuss with the teacher.
Two inactive students out of 40 is a 5% weekly dropout rate. If this pattern continues, you will lose a significant portion of your student base within a month. Early intervention is key.
Step 3: Investigate Homework Completion
The homework completion rate dropped from 82% to 78%. Drill into the data to understand why.
Open Homework Analytics
From the student progress dashboard, click on the Homework metric to drill down.
Break Down by Course
Look at homework completion by course. You might see:
| Course | Completion Rate |
|---|---|
| Spanish A1 | 91% |
| English B2 | 85% |
| German A2 | 72% |
| French A1 | 60% |
The French A1 course has a significantly lower rate and is likely driving the overall decline.
Break Down by Teacher
Check which teacher is assigned to French A1 and look at their homework turnaround time. If the teacher is slow to assign or grade homework, students may lose motivation.
Take Action
- Discuss the homework completion rate with the French A1 teacher.
- Ask whether the homework is too difficult or too time-consuming.
- Check whether homework feedback is being provided promptly.
- Consider adjusting the homework cost if the school-balance charge is deterring students.
Step 4: Review Teacher Performance
Open Teacher Performance Metrics
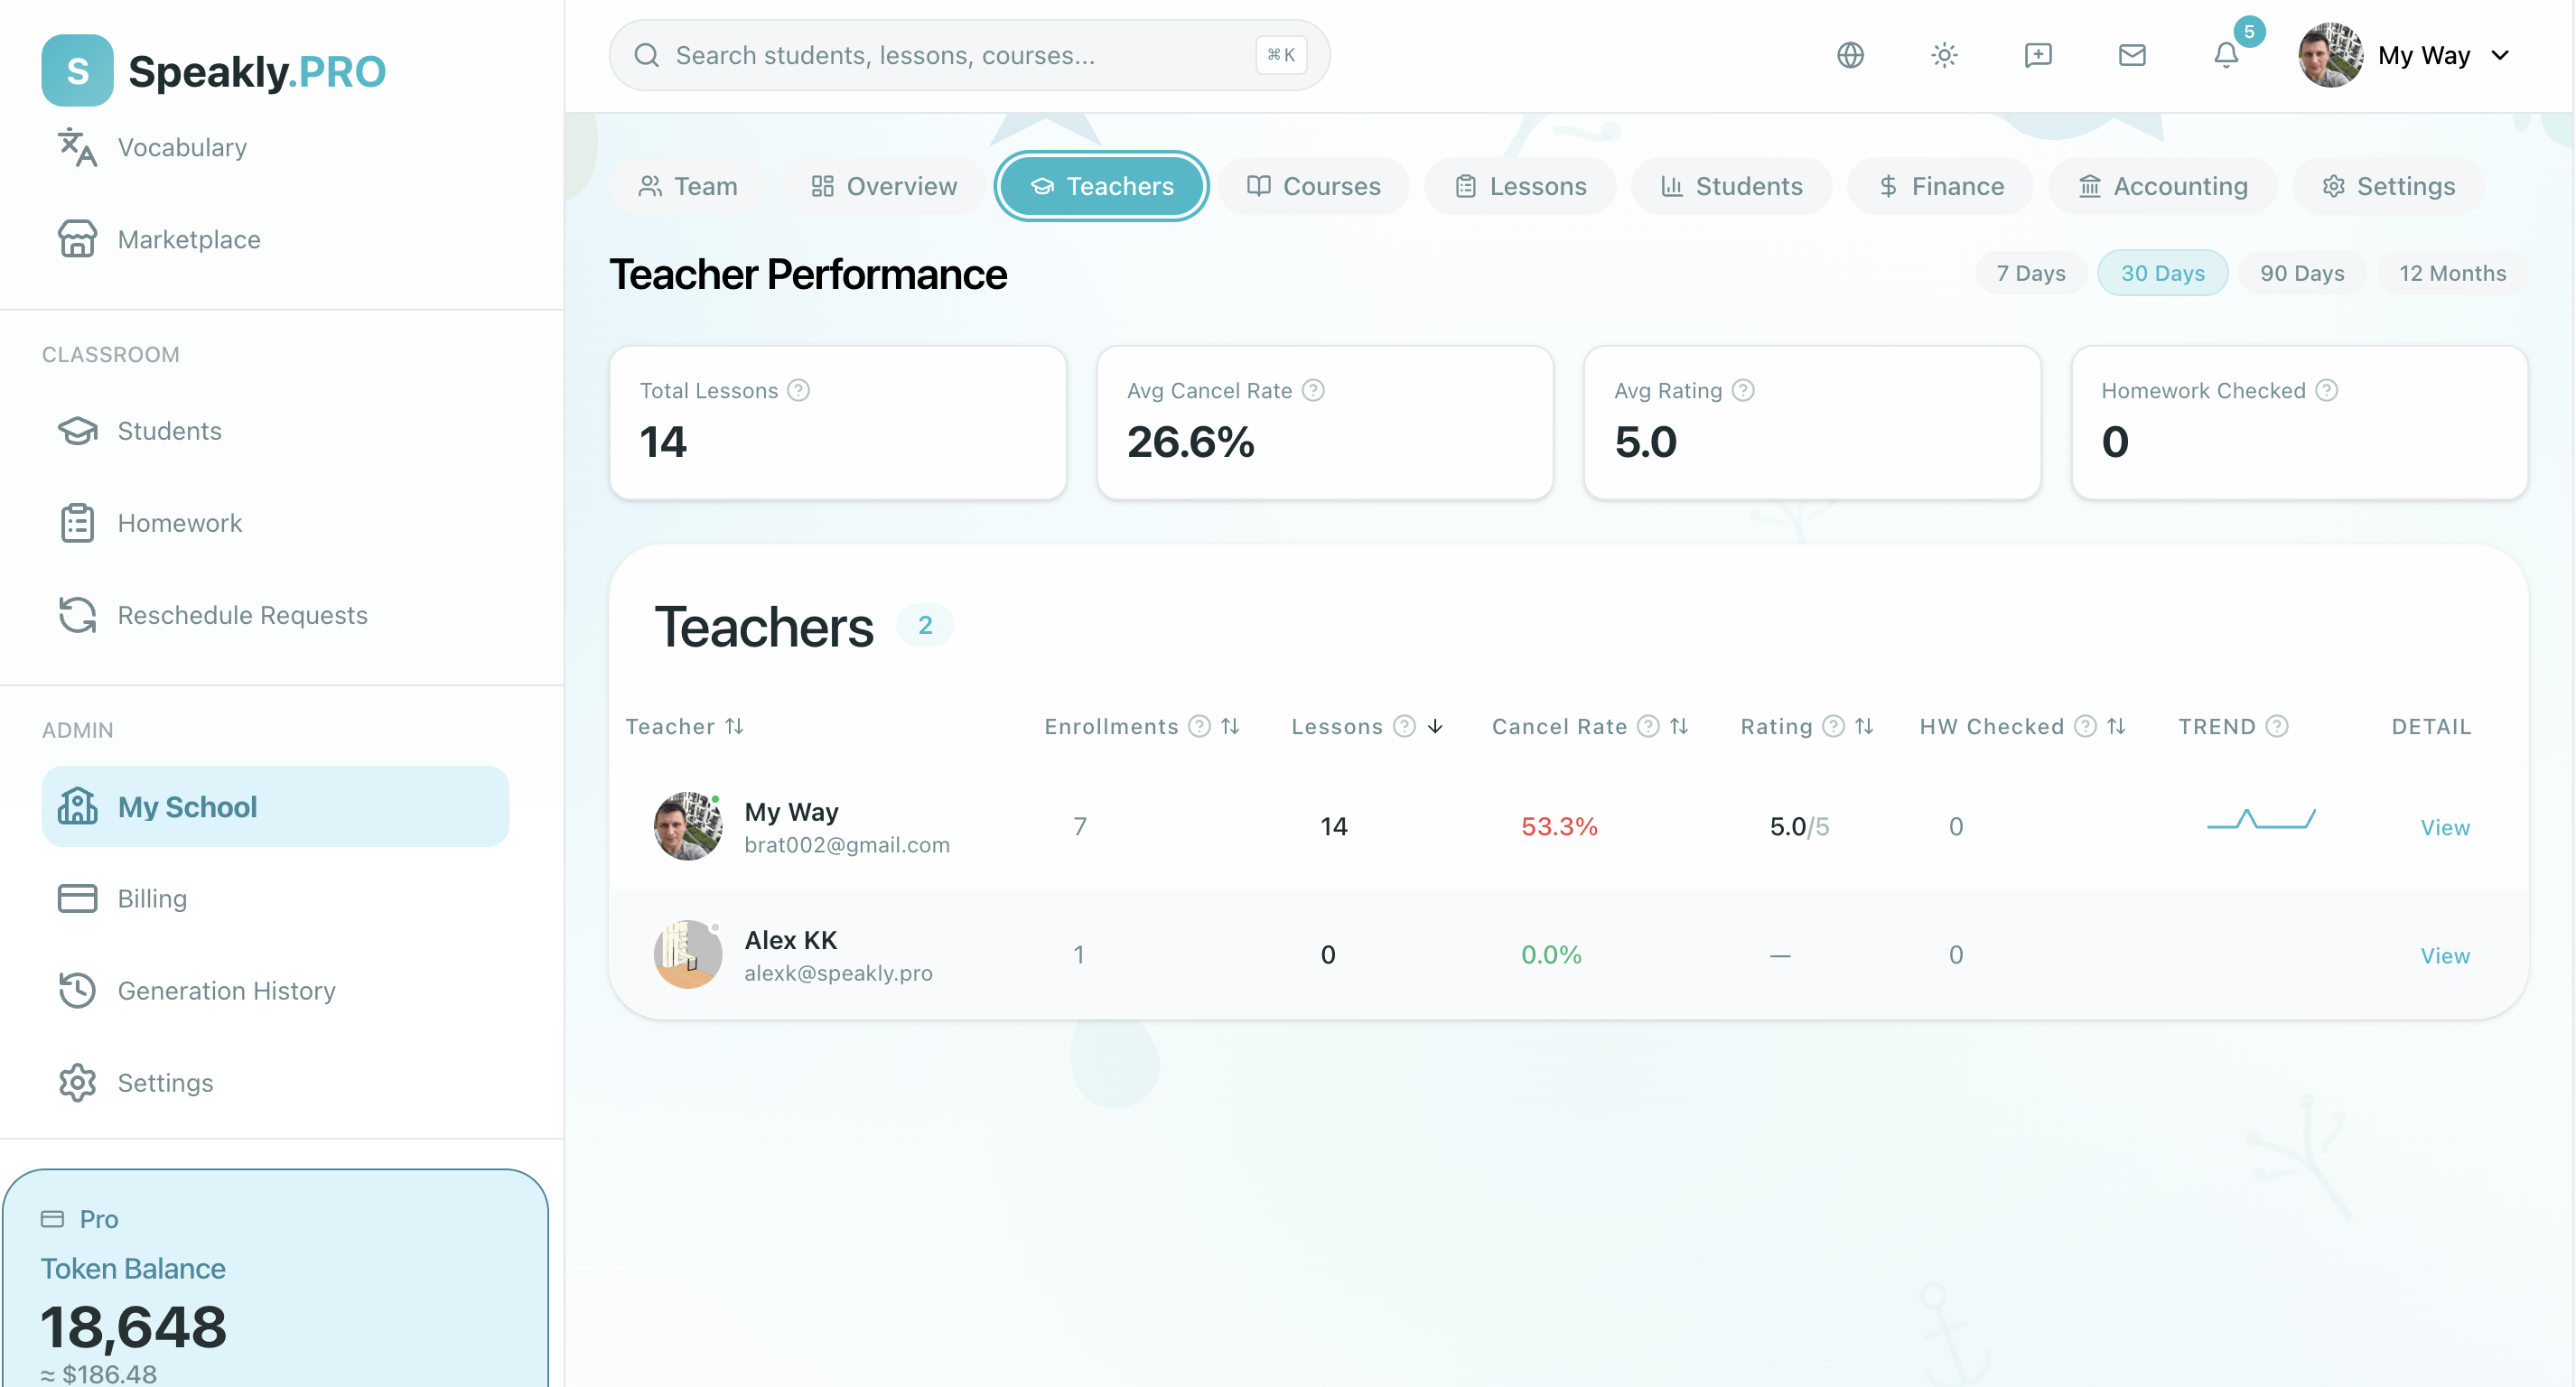
Navigate to My School > Teachers.
Compare Key Indicators
Review the teacher comparison table:
| Teacher | Enrollments | Lessons Conducted | Cancellation Rate | Rating | Homework Checked | Trend |
|---|---|---|---|---|---|---|
| Maria | 12 | 32 | 3% | 4.8 | 28 | -- |
| Alex | 10 | 24 | 5% | 4.5 | 20 | -- |
| Yuki | 8 | 28 | 2% | 4.9 | 22 | -- |
| Carlos | 6 | 12 | 15% | 3.8 | 8 | -- |
| Sophie | 4 | 16 | 4% | 4.6 | 14 | -- |
Identify Patterns
Carlos stands out: fewer lessons conducted, the highest cancellation rate (15%), the lowest rating (3.8), and the fewest homework assignments checked. This warrants further investigation.
Investigate Further
Check whether the teacher has scheduling conflicts or needs help with platform tools.
Step 5: Review Course Effectiveness
Open Course Analytics
Navigate to My School > Courses.
Check Completion Rates
For each course, note the completion rate and dropout rate. Courses with a dropout rate above 20% need attention.
Investigate Problem Lessons
If a course has high dropout, drill into the lesson-level data. Look for:
- Lessons with low completion -- students are getting stuck.
- Lessons with unusually long time spent -- content may be too complex.
- Lessons with low scores -- the material may be above the students' level.
Share Findings with Teachers
Send the teacher a message with specific data: "Lesson 5 in German A2 has a 45% completion rate compared to 80% for the surrounding lessons. Can we review the content?"
Step 6: Check AI Credits and Accounting
Review AI Credit Usage
Navigate to My School > AI Credits and review current availability, usage, reservations, and warnings for the last 7 days. For real-money entries, use My School > Accounting.
Summarize Spending by Category
| Category | Relative usage |
|---|---|
| AI generation | Higher or lower than the previous period |
| Assessment | Higher or lower than the previous period |
| Text-to-speech | Higher or lower than the previous period |
| Total | Compare with the previous period |
Compare to Budget
If current usage exceeds the budget or threshold configured for your school, investigate the AI generation spike. Was a teacher experimenting with AI features, or is this the new normal?
Adjust if Needed
If spending is trending up, consider adding AI credit or setting spending limits for individual teachers.
Three controls make this less of a manual chore:
- AI credit budgets give one teacher a weekly or monthly ceiling and notify you when they approach it, instead of you noticing afterwards.
- The low AI credit balance alert threshold emails you when the school's balance drops below an amount you choose, so a run-dry does not surprise you mid-week.
- The AI charges ledger itemizes the spend nobody clicked buy for — recordings, certificates, and marketplace fees — which is usually where an unexplained increase turns out to be.
See Accounting & Billing.
Make analytics reviews a weekly habit. Block 30 minutes each Monday morning to go through these steps and catch any issues early.
Two queues, not one. The Pending approval requests widget on the Learning Path page holds teachers' manual-release requests. Assessment checks, in My workspace, holds AI-assisted assessment results waiting on a human decision. Neither badge counts the other, and an unresolved assessment check can block a certificate. See AI Oversight and Human Review.